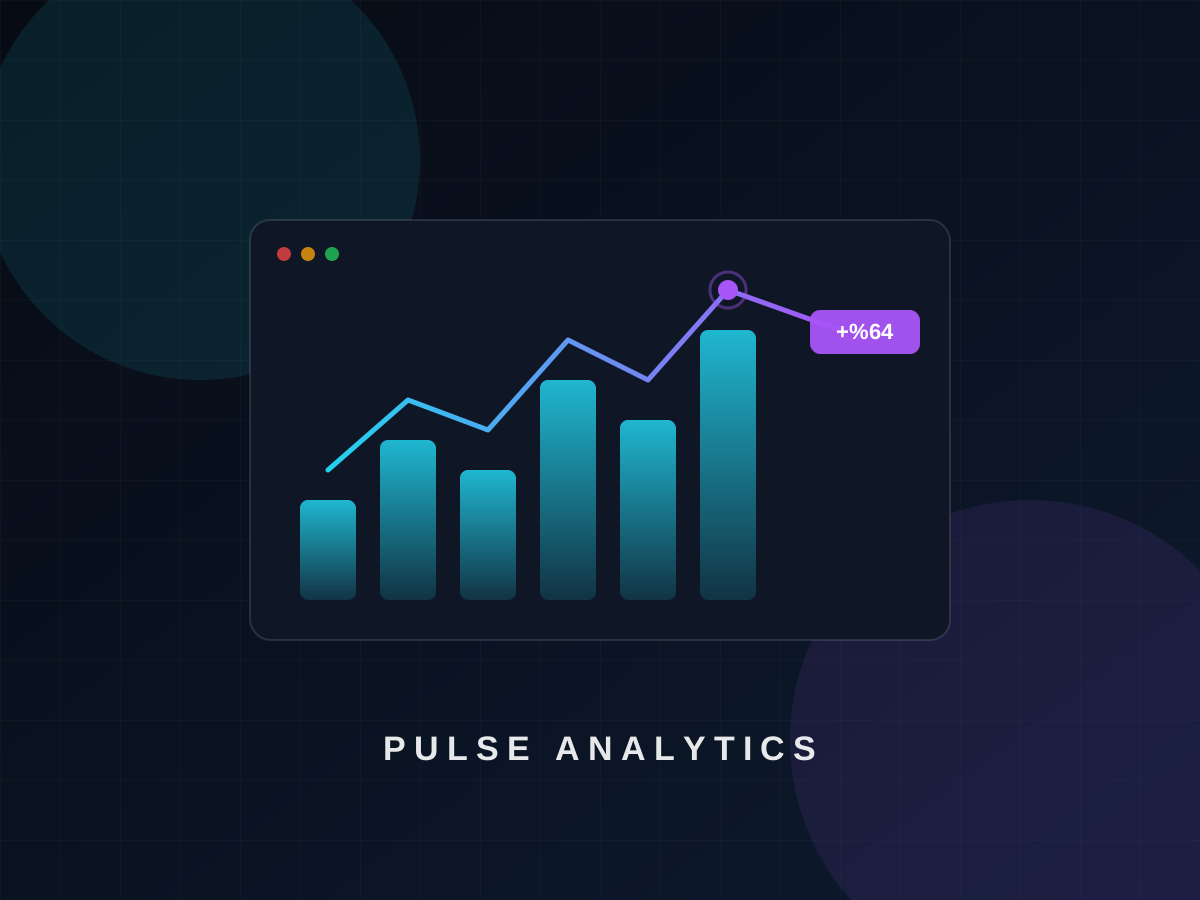
Pulse — Data Visualization Platform
A SaaS analytics panel querying millions of rows in under a second, with drag-and-drop custom dashboards. 30+ enterprise clients.
Challenge
Typical client datasets ran 50–200 million rows. The target: sub-second responses, end-user dashboards built by drag and drop, and white-label theming.
Solution
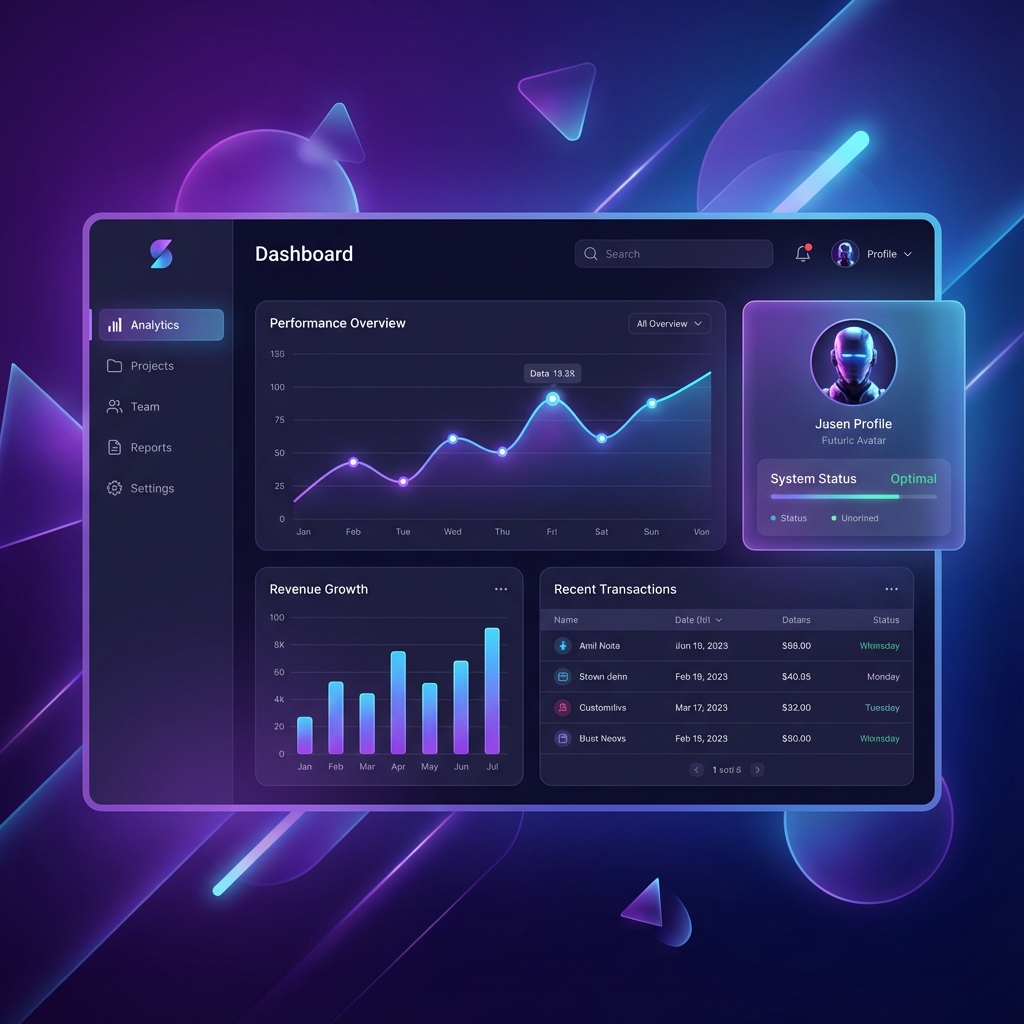
ClickHouse for analytical queries (columnar aggregations in milliseconds), PostgreSQL for operational data, a smart cache + pre-aggregation layer for the 20 most common query patterns, a React dashboard builder with 14 visualization types and live data over WebSocket.
Results
Median query response 0.6s across 30+ enterprise clients; usage frequency up 22× versus the PDF-report era. Pulse tripled ARR the year after launch.

Have a project in mind? Let's talk.
Tell us about your project over a coffee; we will map the road and send a transparent quote. The first call is always free.
Book a Free Call